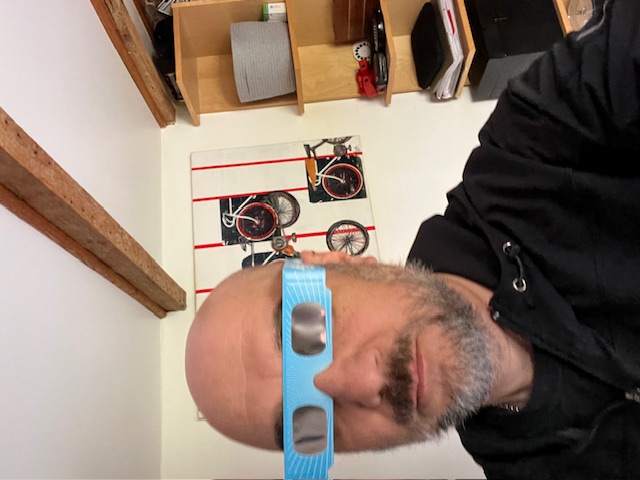
Hi, my name is Aidin, and I'm thrilled to share my portfolio with you. I'm a Web Developer based in DC metro area, with a journey that's taken me through some fantastic stops like HZDG, BOOZ ALLEN HAMILTON, IFMM, MODIS, RavandWebSolutions, IMS and NADA.
These days, my focus is on UI/UX, as well as developing fast loading web applications that shine across different browsers and devices. Throughout my career, I've had the pleasure of collaborating with incredibly talented folks on projects like Volkswagen Parts, Washington Harbour, Torti Gallas, the Washington football team, Rockefeller Center, USPS & FDA websites, NIH / NCI & NHLBI and NADA.
As a UI/UX Developer, I get to play with cool tech like JavaScript, Node.js, PHP, Python, and frameworks like React, Vue, jQuery, besides popular designing tools Adobe XD ,Sketch and Figma.
Apart from geeking out over code, I'm fluent in English, Farsi, and German. When I'm not at my keyboard, you'll find me hanging out with friends, exploring new places, or diving into my passions for cars, bikes, and music.
// App.js
import React, { useState, useEffect } from 'react';
import * as d3 from 'd3'; // Import D3 library
import './App.css'; // Import CSS file
import monthsData from './months.json'; // Import months data
import daytempData from './daytemp.json'; // Import day temperature data
// Function to get short month names
const getShortMonthName = (month) => {
const shortNames = {
"January": "Jan",
"February": "Feb",
"March": "Mar",
"April": "Apr",
"May": "May",
"June": "Jun",
"July": "Jul",
"August": "Aug",
"September": "Sep",
"October": "Oct",
"November": "Nov",
"December": "Dec"
};
return shortNames[month];
};
// Functional component for Bar Chart
const BarChart = ({ data, color, showShortNames, onBarClick }) => {
const svgRef = React.useRef(); // Reference for SVG element
// Function to draw the chart
const drawChart = React.useCallback(() => {
if (!data || data.length === 0) return; // Return if data is empty
// Define chart dimensions and margins
const width = 540; // Reduce width by 10%
const height = 360; // Reduce height by 10%
const marginTop = 54; // Increase margin top to maintain position
const marginLeft = 54; // Increase margin left to maintain position
const margin = { top: marginTop, right: 40, bottom: 40, left: marginLeft };
const innerWidth = width - margin.left - margin.right;
const innerHeight = height - margin.top - margin.bottom;
// Select SVG element
const svg = d3.select(svgRef.current);
svg.selectAll("*").remove(); // Remove existing elements
// Append chart group
const chart = svg.append("g")
.attr("class", "chart-group") // Add class attribute
.attr("transform", `translate(${margin.left}, ${margin.top})`);
// Create scales
const x = d3.scaleBand()
.domain(data.map(d => d.day))
.range([0, width])
.padding(0.2);
const y = d3.scaleLinear()
.domain([0, d3.max(data, d => d.value)])
.nice()
.range([height, 0]);
// Append bars
chart.selectAll(".bar")
.data(data)
.enter().append("rect")
.attr("class", "bar")
.attr("id", (d, i) => `bar-${i}`) // Add id attribute
.attr("x", d => x(d.day))
.attr("width", x.bandwidth())
.attr("y", d => height)
.attr("height", 0)
.attr("fill", color)
.on("click", (event, d) => {
if (onBarClick) {
onBarClick(d.fullMonth, d.day); // Pass month and day to the parent component
}
})
.transition()
.duration(1000)
.attr("y", d => y(d.value))
.attr("height", d => height - y(d.value));
// Append bar labels
chart.selectAll(".bar-label")
.data(data)
.enter().append("text")
.attr("class", "bar-label")
.attr("x", d => x(d.day) + x.bandwidth() / 2)
.attr("y", d => y(d.value) - 5)
.attr("text-anchor", "middle")
.attr("font-size", "12px")
.attr("fill", "black")
.text(d => Math.round(d.value));
// Append month labels
chart.selectAll(".month-label")
.data(data)
.enter().append("text")
.attr("class", "month-label")
.attr("x", d => x(d.day) + x.bandwidth() / 2)
.attr("y", height + 25)
.attr("text-anchor", "middle")
.attr("font-size", "12px")
.attr("fill", "black")
.text(d => showShortNames ? getShortMonthName(d.fullMonth) : d.fullMonth);
// Append day labels
chart.selectAll(".day-label")
.data(data)
.enter().append("text")
.attr("class", "day-label")
.attr("x", d => x(d.day) + x.bandwidth() / 2)
.attr("y", height + 15)
.attr("text-anchor", "middle")
.attr("font-size", "10px")
.attr("fill", "black")
.text(d => d.day);
}, [data, color, showShortNames, onBarClick]); // Dependencies for the drawChart function
useEffect(() => {
drawChart(); // Call drawChart function when component mounts or dependencies change
}, [drawChart]);
return ; // Return SVG element with id and class attributes
};
// Main App component
const App = () => {
const [selectedMonth, setSelectedMonth] = useState("January"); // State for selected month
const [monthData, setMonthData] = useState([]); // State for month data
const [myYear, setMyYear] = useState([]); // State for yearly data
const [showMonthlyChart, setShowMonthlyChart] = useState(false); // State to toggle monthly chart visibility
const [selectedDay, setSelectedDay] = useState(null); // State for selected day
// Function to handle yearly bar click
const handleYearlyBarClick = (month) => {
setSelectedMonth(month);
setShowMonthlyChart(true);
};
// Function to handle day bar click
const handleDayBarClick = (month, day) => {
setSelectedDay(day); // Update selected day state
const selectedMonthDropdown = document.getElementById("month-dropdown");
const selectedMonthValue = selectedMonthDropdown.value;
console.log("Selected Day :", day);
console.log("Selected Month:", selectedMonthValue); // Log selected month
// Loop through each month index (0 to 11)
for (let i = 0; i < 12; i++) {
const selectedMonthData = daytempData.find(item => Object.keys(item)[i] === selectedMonthValue);
if (selectedMonthData) {
const monthData = selectedMonthData[selectedMonthValue];
const selectedDayData = monthData.days.find(dayData => dayData.day === day);
if (selectedDayData) {
console.log(`Data for ${selectedMonthValue}, Day ${day}:`, selectedDayData);
// Render new chart
renderDayChart(selectedDayData);
} else {
console.log(`Data not found for ${selectedMonthValue}, Day ${day}`);
}
return; // Exit the loop once the data is found
}
}
console.log(`Data not found for ${selectedMonthValue}`);
};
// Function to render the new chart for the selected day
const renderDayChart = (temperatures) => {
let selectedDaySelected = temperatures.day;
let selectedTempratures = temperatures.temperatures;
const chartContainer = document.getElementById("day-chart-container"); // Select chart container
// Check if chart container exists
if (!chartContainer) {
console.error("Chart container not found");
return;
}
chartContainer.innerHTML = ""; // Clear previous chart
// Define chart dimensions and margins
const width = 600;
const height = 400;
const marginTop = 60; // Increased margin top
const marginLeft = 60; // Increased margin left
const margin = { top: marginTop, right: 40, bottom: 40, left: marginLeft };
const innerWidth = width - margin.left - margin.right;
const innerHeight = height - margin.top - margin.bottom;
// Create SVG element
const svg = d3.select(chartContainer)
.append("svg")
.attr("width", width)
.attr("height", height);
// Create the title using the selected month and day
const title = `Every 6 hours temperature of ${selectedMonth} ${selectedDaySelected}`;
// Append title
svg.append("text")
.attr("class", "chart-title")
.attr("x", 225) // Set x-coordinate to 225
.attr("y", margin.top / 2 + 5 + 5) // Adjusted y-coordinate with a margin of 10 pixels
.attr("text-anchor", "middle")
.attr("font-size", "16px")
.text(`Every 6 hours temperature of ${selectedMonth} ${selectedDaySelected}`);
// Create scale for x-axis
const xScale = d3.scaleLinear()
.domain([0, d3.max(selectedTempratures)])
.range([margin.left, innerWidth - margin.right]); // Adjusted range to leave space for the bars
// Create scale for y-axis
const yScale = d3.scaleBand()
.domain(selectedTempratures.map((_, i) => i))
.range([margin.top, innerHeight])
.padding(0.1);
// Append bars
svg.selectAll(".bar")
.data(selectedTempratures)
.enter().append("rect")
.attr("class", "bar")
.attr("x", margin.left)
.attr("y", (d, i) => yScale(i))
.attr("width", d => xScale(d) - margin.left) // Adjusted width calculation
.attr("height", yScale.bandwidth())
.attr("fill", "steelblue")
.transition()
.duration(1000)
.attr("width", d => xScale(d) - margin.left - 20); // Adjusted width calculation
// Append temperature labels
svg.selectAll(".temperature-label")
.data(selectedTempratures)
.enter().append("text")
.attr("class", "temperature-label")
.attr("x", d => xScale(d) + 5)
.attr("y", (d, i) => yScale(i) + yScale.bandwidth() / 2 - 10) // Adjusted y-coordinate
.attr("dy", "0.35em")
.attr("font-size", "12px")
.attr("fill", "black")
.text(d => d)
.style("opacity", 0) // Start with opacity 0 for animation
.transition()
.duration(1000)
.style("opacity", 1); // Transition to full opacity
};
// useEffect to compute yearly averages
useEffect(() => {
const yearAverages = [];
const fullMonthNames = ["January", "February", "March", "April", "May", "June", "July", "August", "September", "October", "November", "December"];
for (const monthObj of monthsData) {
const month = Object.keys(monthObj)[0];
const data = monthObj[month];
const sum = data.reduce((acc, cur) => acc + cur.value, 0);
const average = sum / data.length;
yearAverages.push({ day: getShortMonthName(month), fullMonth: month, value: average });
}
const uniqueMonths = [...new Set(yearAverages.map(item => item.day))];
const filteredYearData = yearAverages.filter(item => uniqueMonths.includes(item.day));
setMyYear(filteredYearData);
}, []);
// useEffect to set monthly data
useEffect(() => {
const selectedMonthData = monthsData.find(month => Object.keys(month)[0] === selectedMonth);
setMonthData(selectedMonthData[selectedMonth]);
}, [selectedMonth]);
return (
Temperature Chart
Daily temperature
Yearly Average
Thank you for your feedback!
import React, { useState, useEffect } from 'react';
import { v4 as uuidv4 } from 'uuid'; // Import uuidv4 from uuid library
import config from './config';
import { CosmosClient } from '@azure/cosmos';
const Trivia = () => {
const [question, setQuestion] = useState(null);
const [userAnswer, setUserAnswer] = useState(null);
const [showResults, setShowResults] = useState(false);
const [selectedFeedback, setSelectedFeedback] = useState(null);
const [answer, setAnswer] = useState(null);
const [submissionTime, setSubmissionTime] = useState(null);
const [feedbackSubmitted, setFeedbackSubmitted] = useState(false);
const [countdown, setCountdown] = useState(150);
const [isAnswerCorrect, setIsAnswerCorrect] = useState(null);
const fetchData = async () => {
try {
const client = new CosmosClient({
endpoint: `https://${config.cosmosDbEndpoint}`,
key: 'Sku9HYNfkbqiu4GOYYqY8CvTKPwOVSPRovvA1urdQQoljc7nm9crNRYtFEgpp8zpSyCZxYObXK1HXznlkBXhAQ==',
});
const container = client
.database(config.databaseId)
.container(config.containerId);
const { resources } = await container.items.readAll().fetchAll();
const randomIndex = Math.floor(Math.random() * resources.length);
const randomQuestion = resources[randomIndex];
setQuestion({
...randomQuestion,
description: randomQuestion.description,
});
setAnswer(randomQuestion.correctanswer);
console.log('Correct Answer:', randomQuestion.correctanswer);
} catch (error) {
console.error('Error fetching data from Cosmos DB:', error);
}
};
useEffect(() => {
if (showResults) {
const intervalId = setInterval(() => {
setCountdown((prevCountdown) => (prevCountdown > 0 ? prevCountdown - 1 : 0));
}, 100);
return () => {
clearInterval(intervalId);
};
}
}, [showResults]);
const progressBarStyle = {
width: `${(countdown / 150) * 100}%`, // Adjust based on your requirements
};
useEffect(() => {
if (countdown === 0) {
resetQuiz();
setCountdown(150);
}
}, [countdown]);
useEffect(() => {
fetchData();
setSelectedFeedback(null);
setSubmissionTime(null);
setFeedbackSubmitted(false);
setIsAnswerCorrect(null);
}, []);
const handleAnswerSelection = async (selectedAnswer) => {
setUserAnswer(selectedAnswer);
const isCorrect = selectedAnswer === answer;
setIsAnswerCorrect(isCorrect);
setShowResults(true);
const answerData = {
id: uuidv4(),
questionId: question.id,
chosenAnswer: selectedAnswer,
isCorrect: isCorrect ? 1 : 0,
timestamp: new Date().toISOString(),
};
await writeToCosmos(answerData, 'answers');
setSubmissionTime(answerData.timestamp);
};
const resetQuiz = () => {
setQuestion(null);
setUserAnswer(null);
setShowResults(false);
setSelectedFeedback(null);
setSubmissionTime(null);
setFeedbackSubmitted(false);
setIsAnswerCorrect(null);
setCountdown(20); // Reset the countdown to the initial value
fetchData();
};
const calculateScore = () => {
return userAnswer === answer ? 1 : 0;
};
const handleFeedbackSelection = async (event) => {
if (!feedbackSubmitted) {
const selectedValue = parseInt(event.target.value, 10);
setSelectedFeedback(selectedValue);
const feedbackItem = {
id: uuidv4(),
userFeedback: selectedValue,
submissionTime: new Date().toLocaleString(),
};
await writeToCosmos(feedbackItem, 'feedbacks');
setSubmissionTime(feedbackItem.submissionTime);
setFeedbackSubmitted(true);
}
};
const getFeedbackDescription = () => {
switch (selectedFeedback) {
case 1:
return 'Very Satisfied';
case 2:
return 'Satisfied';
case 3:
return 'Neutral';
case 4:
return 'Unsatisfied';
case 5:
return 'Very Unsatisfied';
default:
return '';
}
};
const writeToCosmos = async (dataToWrite, containerName) => {
try {
const client = new CosmosClient({
endpoint: `https://${config.cosmosDbEndpoint}`,
key: 'Sku9HYNfkbqiu4GOYYqY8CvTKPwOVSPRovvA1urdQQoljc7nm9crNRYtFEgpp8zpSyCZxYObXK1HXznlkBXhAQ==',
});
const container = client
.database(config.databaseId)
.container(containerName);
await container.items.create(dataToWrite);
console.log('Item created successfully in Cosmos DB');
} catch (error) {
console.error('Error writing to Cosmos DB:', error);
}
};
const thankYouMessage = feedbackSubmitted ? (
{answer}
)}
Next question loading in...{(countdown / 10).toFixed(0)} seconds
}
)}
{question.answers &&
question.answers.map((answer) => (
Tell us how you're feeling about NADA Show 2024!
Chosen password: {password} Password Strength: {score}/4
import React, { useState } from 'react';
import zxcvbn from 'zxcvbn';
const PasswordInputWithReset = () => {
const [password, setPassword] = useState('');
const [score, setScore] = useState(0);
const handlePasswordChange = (event) => {
const newPassword = event.target.value;
setPassword(newPassword);
const result = zxcvbn(newPassword);
setScore(result.score);
};
const handleReset = () => {
setPassword('');
setScore(0);
};
return (
{hashedPassword && Show Hashed Password: {hashedPassword}
import React, { useState } from 'react';
import './App.css';
import bcrypt from 'bcryptjs';
function PasswordHasher() {
const [password, setPassword] = useState('');
const [hashedPassword, setHashedPassword] = useState('');
const handlePasswordChange = (e) => {
setPassword(e.target.value);
};
const handleHashPassword = () => {
if (password) {
const saltRounds = 10; // Adjust the number of salt rounds as needed
const hashed = bcrypt.hashSync(password, saltRounds);
setHashedPassword(hashed);
}
};
const handleClearInput = () => {
setPassword('');
setHashedPassword('');
};
return (